Please note — this article has been updated to reflect Canon’s recent changes in MTF charts, and the evaluation methods used to produce them. Canon, Inc. introduced these changes coinciding with the launch of the EOS R mirrorless system, in late 2018.
Most photography and video enthusiasts have seen “MTF” (Modulation Transfer Function) charts for different lenses, but perhaps have not been entirely clear on exactly what they communicate. We know they’re supposed to give an indication of a lens’ expected optical performance, but beyond that it may be a bit of a mystery. We’ll try to move past the technical terms and explain them here in a real-world way.
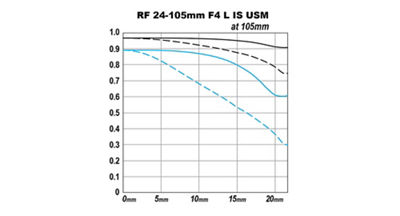
Canon and other lens makers have published MTF charts in brochures, articles and online for some time. While it’s not always possible to directly compare a chart from Company A with one from Company B (they may use different measurement standards, for instance), MTF charts are essentially similar. So if you understand how to read and assess Canon’s charts, you’ll be able to evaluate those from other sources as well.
WHY ARE MTF CHARTS SIGNIFICANT?
It would be great if we could say that every lens produced is a perfect lens, but unfortunately even at the highest levels, that’s not the case. Every lens ever manufactured has some inherent limits in its ability to render perfectly-reproduced detail from a scene or subject onto a digital image sensor or piece of film. Various imperfections, under the broad umbrella of “lens aberrations,” are present even in the finest of lenses. And they’re often more prevalent in some situations than in others — at a lens’s widest aperture, for instance, it can typically be expected to show more types of visible imperfections in an image than it might with the aperture stopped down two or three stops. The same applies at the wide-angle end of a zoom lens’ range versus its telephoto end. Optical performance can and will change, at least subtly, and so on.
MTF charts give the serious photographer a way to compare how some of these aberrations can impact a lens’ ability to transmit detail and contrast to the film plane or image sensor, and provide a meaningful method of making comparisons between one lens and another. MTF charts aren’t all-encompassing, nor are they the last word in assessing image quality. We’ll mention why as we close this article. But for now, let’s begin to understand what MTF charts measure and what they tell us in the first place.
HORIZONTAL AND VERTICAL COMPONENTS OF AN MTF CHART
One inherent fact of most lenses is that their sharpness, contrast and fidelity tend to be better dead-center in an image, and slowly drop in performance as we move outward from the center toward any of the corners of a picture. At the extreme corners of an image, most lenses are performing at a lower level of total image quality than they do at the center.
The first thing an MTF chart displays is the distance from the center to the corner of a “full-frame” image. All MTF charts for Canon EF, TS-E and MP-E lenses assume a full-frame image at 36x24mm in size (the same size as a traditional 35mm film negative or transparency). Canon MTF charts for EF-S and EF-M lenses — made exclusively for smaller APS-C sensor cameras, such as the EOS Rebel series and EOS M-series — takes this into account and measure a smaller diagonal area.
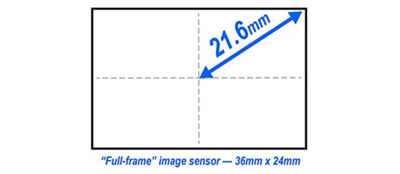
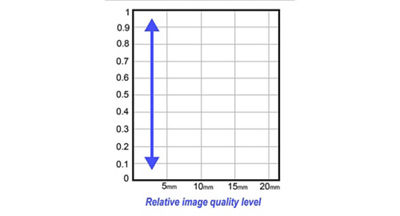
On a full-frame sensor, 36x24mm in size, the distance of a diagonal line from the center to one corner is 21.6mm (one-half of the diagonal of the full frame area). So, along the bottom horizontal axis of a Canon MTF chart, you’ll see markings starting at zero and moving past 20mm to include this 21.6mm center-to-corner distance of a full-frame image sensor. This is sometimes referred to as “image height.”
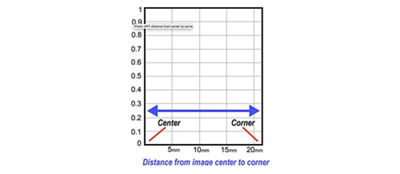
In the vertical axis, you’ll see indications from zero at the bottom to “1” at the top. These indicate the relative fidelity and optical quality level. The higher a curve on an MTF chart is, the better it’s performing in the areas the chart is measuring.
An MTF chart begins by measuring optical performance at the center of the picture area and then measures repeatedly along a diagonal line, further and further toward the corners of the image. The quality measurements obtained are then plotted on the MTF graph, showing you how far from the center they’re taken from as you look from left to right on the chart. The farther to the right, the closer to the corner the measurement is. And the higher on the scale the resulting lines are, the better the MTF characteristics of that lens are.
CONTRAST AND RESOLUTION — THE TWO ITEMS MEASURED BY MTF
Canon engineers use sophisticated computer techniques to generate MTF data across the entire image area, based on design values of the optical formula. By calculating how well a lens can reproduce patterns of fine repeating lines, its optical limits can be determined and become part of an MTF chart’s information. Obviously, the better a lens’ optical performance, the more accurately it can display these precise, fine lines.
While a photographer might simply think that one test to measure “sharpness” would give all the information he or she would need, there is more to it than that. Most optical engineers agree that in evaluating a lens’ optical performance, there are two distinctly different aspects to overall lens quality — contrast and resolution. They may sound like the same thing, but they’re not. And MTF charts are intended to display the differences between these two key factors.
- Understanding Contrast: Simply stated, contrast is a lens’ ability to display a clear distinction between dark and light subject levels, both on an MTF chart and on an imaging sensor (or piece of film). When the dark edge of a fine black line ends and the adjacent white background area begins, a perfect lens would theoretically provide a total shift from black to white information with no fuzziness and blends into shades of gray, and so on. Not all lenses can render this sudden shift cleanly, or they may do it better at the center of a picture than at the outer edges or corners.
- Resolution: Again, it may seem like we’re speaking of the same thing, but there are definite differences to an optical engineer or lens designer. Resolution measures the ability of a lens to precisely reproduce a fine subject point and, in a general sense, gives an idea of a lens’ ability to render extremely fine detail. However, a hypothetical lens with high resolution numbers and low contrast can often appear to in fact be producing soft, muddy images – mostly due to the subject detail being compromised by this lens’ inability to render a clean, consistent difference between light and dark parts of subject detail.
While many enthusiasts may feel that high resolution is the most important aspect of a good lens, there are a good number of optical engineers who feel that higher contrast will result in a lens that more users will regard as “sharp.” And, in a very general sense, there are rules of thumb among lens designers that say that as a lens’ contrast performance is increased, it becomes progressively difficult to engineer in high-resolution performance and vice-versa.
The bottom line, of course, is that it’s a balance between good performance in both contrast and resolution that provides optimal performance in today’s camera lenses.
ACTUAL MEASUREMENT OF CONTRAST AND RESOLUTION
Worldwide, there are a variety of test techniques, methods and test charts used by different optical engineers to measure lens performance in controlled conditions. Regardless, their ultimate aim is to generate data that can be plotted on a chart and provide dealers and customers with an idea of the relative optical performance they can expect from a given lens design.
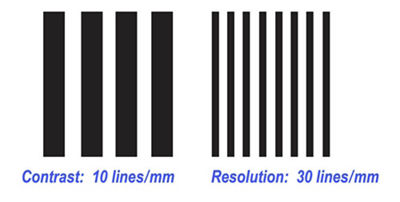
Contrast is measured by testing how a lens performs with broader and thicker sets of lines. These are spaced at a rate of 10 lines per millimeter (lpm). While that sounds super thin, they are relatively thick for optical test purposes. The lens’ ability to display a clean consistent break between the line and its adjacent background is repeatedly measured, starting at the center of an image then working its way toward the far corners.
Resolution, the lens’s ability to render extremely fine detail, is measured with similar sets of repeating lines, but they’re much finer. Spaced at 30 lines per millimeter, these super thin lines will make or break a lens’ ability to record and display fine detail in actual images. When a lens reaches the limits of its resolving power, these repeating lines will no longer appear distinct and will seem to blur together when reviewed by engineers. Resolution is evaluated separately from contrast and the results of the two separate assessments are then plotted on the MTF charts we see online and elsewhere.
UNDERSTANDING SAGITTAL AND MERIDIONAL TEST PATTERNS
It would be natural to assume that a good lens would produce the same “sharpness” results for patterns of parallel repeating lines, no matter what direction the lines were oriented. However, in real-world conditions, that’s not the case — even with some of the finest lenses in the world. Lines running parallel to a diagonal line from the center of an image to one of its corners are often easier for a lens to reproduce accurately and consistently. In fact, some lenses show a marked difference in cleanly reproducing lines arranged perpendicular (90˚) to this diagonal direction. MTF charts display these variations and they’re an important part of what MTF data tells us.
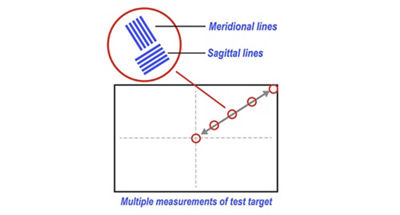
The technical term for lines arranged parallel to a diagonal line from center to corner of the film or image sensor area is “Sagittal.” You can think of Sagittal lines as like spokes on a wheel, radiating outward from the center of the image area.
Lines perpendicular to this are called “Meridional.” Again, using the wheel analogy for a moment, Meridional lines would run in the direction of the outer, circular edge of the wheel. They’re straight lines, not curved, and essentially at a 90° angle to the “spokes” of the wheel.
In Canon’s MTF charts for EOS lenses, you may see a descriptive chart referring to “Spatial frequency,” a technical way of saying whether the MTF curve is the contrast curve (derived from measuring thicker lines at 10 lines/mm) or the resolution curve (from reading the finer 30 lines/mm line sets).
And, you’ll see the different lines for Sagittal and Meridional line directions indicated by “S” and “M.”
2018: CHANGES IN CANON'S MTF EVALUATION METHODS, AND MTF CHARTS
In late 2018, coinciding with the introduction of Canon’s RF lens series for full-frame EOS R-series mirrorless cameras, Canon optical engineers made across-the-board changes to the way they evaluate lens optical performance, and how it’s displayed in MTF charts.
Fortunately, for consistency, Canon has updated the MTF charts for all current EF, EF-S, TS-E, MP-E, and EF-M lenses, so that meaningful comparisons can still be made by critical Canon users. Canon RF lenses, of course, are also graded on these updated MTF evaluation methods.
- Previous Canon MTF evaluation standards were calculated from criteria derived years ago from the film (analog) era, and not changed until late 2018
- Optical performance is now measured using more critical, demanding standards, based on digital imaging and the use of high-resolution digital image sensors in digital SLRs and mirrorless cameras
- Canon MTF charts will now only display MTF results at the lens’ widest maximum aperture — previous Canon MTF charts displayed results at both maximum aperture, and at an effective f/8
Because the new, updated MTF measurement system used by Canon is based on stricter, digitally-oriented criteria, if you compare older and new MTF charts, any previously-introduced lens may seem as though some aspects of its MTF results are now lower than before. Rest assured this is because it’s now being graded using more demanding criteria, and does not represent an actual reduction in a given lens’ actual ability to deliver contrast or resolution than it previously did.
THE TEST CURVES ON CANON MTF CHARTS
Canon tests lenses consistently, so that to the greatest degree possible, MTF results from two or more lenses from similar lens categories can be meaningfully compared. The curved lines you see on the MTF charts display the results a given lens delivered.
As of late 2018, Canon now performs MTF tests at wide-open apertures only (at whatever aperture that happens to be with a given lens – such as f/1.2 for a lens like the EF 50mm f/1.2L, or f/5.6 for the EF 800mm f/5.6L IS lens). There are no longer any secondary MTF curves for expected results with the lens stopped-down from a wide-open aperture.
When Canon’s EF tele extenders are tested with compatible Canon lenses, the MTF tests continue to display results at the widest effective aperture with the extender in-place. In other words, if a 2x extender is attached to an extender-compatible lens like the EF 300mm f/2.8L IS, the MTF results are what you’d see at an effective f/5.6 (lens still at its maximum aperture, with the two-stop light reduction normally present when a 2x tele extender is attached).
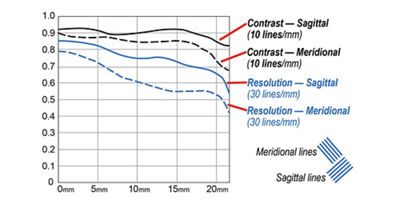
Here’s a breakdown of how to identify the different curves in Canon’s current MTF charts:
- Black, solid curve lines: Sagittal Contrast performance
- Black, dashed lines: Meridional Contrast performance
- Blue, solid lines: Sagittal Resolution performance
- Blue, dashed lines: Meridional Resolution performance
To repeat, in many instances, the Meridional lines are harder for lenses to accurately reproduce, so it’s not uncommon that the dashed lines will appear lower on a Canon MTF chart than corresponding Sagittal lines.
READING AND ASSESSING CANON'S MTF CHARTS
With all that under your belt, you can begin to look critically at Canon’s MTF charts and start to evaluate what they mean for you and your photography. Here are a few points to consider in the published MTF charts you’ll see online or in brochures:
- In general, the higher a curve appears, the better the optical performance it’s describing, either in regards to contrast or resolution.
- A completely hypothetical “perfect” lens, which doesn’t exist in real life, would render MTF results with all its lines running as a completely horizontally straight line across the very top of the chart from the left to right edge. All blue and black, and solid and dashed lines, would be stacked on top of each other. Unfortunately, no lens is likely to deliver this type of performance in an MTF test anytime soon!
- Virtually all lenses will have their curves drop as you follow them from the left to right sides of the MTF chart — indicating optical performance is falling off as you move outward, toward the corners of the image. Especially with wide-angle designs, this is usually normal and typically not cause for alarm or concern. The less precipitous the drop-off, the better the lens’ edge/corner performance will appear.
- You cannot make meaningful comparisons between lenses of different focal length categories strictly based on MTF results. For technical reasons, the MTF results you’ll see from wide-angle and especially ultra-wide lenses will show far more diminished MTF results toward the outer edges (right-hand edge of the curves) than you’ll see with telephoto lenses. This is largely because of fundamental optical characteristics in these types of lenses; it certainly does not mean that you should exclusively shoot with long telephotos! However, the MTF charts can be useful for comparing lenses of similar focal length.
- According to Canon’s engineers, a lens with contrast readings (black lines on the MTF chart) of 0.6 or higher will deliver entirely satisfactory image results, while a lens with contrast ratings of 0.8 or higher is considered “a superior lens.”
- The closer the Sagittal and Meridional lines (solid and dashed lines) are to each other, the more natural the lens’ background blur will usually appear, according to Canon’s optical designers.
LIMITS OF THE INFO IN MTF CHARTS
MTF charts can give the knowledgeable user a good insight into what to expect from a given lens, especially if you begin to compare them with lenses from a similar class. Again, you can make meaningful comparisons between two different 50mm lenses or between a 500mm and 600mm lens. But you absolutely cannot get any fair conclusions by solely comparing MTF results of a 24mm wide-angle lens to a 500mm lens, or even to a 50mm lens.
But while MTF charts indeed can give you some powerful insight into how a lens is likely to perform, keep the following points in mind:
Canon MTF tests are performed only at wide-open aperture
As noted previously, Canon’s engineers now publish MTF tests on Canon lenses exclusively at one aperture: wide-open. You cannot, for instance, determine from the available MTF data whether and to what degree optical performance at the smallest aperture, such as f/22, might suffer from the results of diffraction, nor whether there are significant benefits to be had by stopping down from a lens’ widest aperture by two or three stops.
Data from MTF charts may not be conclusive for photographers in fields like landscape or macro shooting, who may frequently use very small lens apertures for extended depth-of-field. Likewise, with a fast-aperture lens, you cannot tell what the impact would be from stopping the lens down only one f-stop, or a fraction of a stop, from wide-open. Finally, MTF charts will not directly tell you if there’s an optimum aperture for contrast and resolution for a given lens — they can only report the results it delivers at its widest aperture.
MTF charts only measure contrast and resolution
There are numerous optical aberrations that do not come into play in MTF charts — even a lens with stellar MTF results may exhibit one or more of these. Aberrations such as linear distortion (curvature of straight lines), light fall-off at the outer edges of an image, chromatic aberrations, comatic aberrations, flare in back-lit situations and more may appear in certain real-life situations for critical shooters and would not be a factor in MTF results.
MTF charts measure performance at only one focus distance
One variable in a lens’ optical performance is the distance at which it’s focused. Most non-macro lenses are engineered to produce their best optical quality at “normal” focus distances and some aspects of their performance may drop at closer distances. Again, MTF charts give some good meaningful insight into how a lens may perform, but factor in your own anticipated use and remember that MTF tests can’t account for every variable.
Zoom lenses are only tested at their widest and longest zoom settings
While many shooters often use the lens’ widest or longest zoom settings, MTF charts do not provide details on contrast or resolution to expect at mid-range zoom settings — a factor for users whose style may often call for more modest focal-length settings. And, you can’t always assume that at a given intermediate zoom setting, its MTF results would simply be “between” what you see on the MTF chart for its wide and tele settings.
MTF charts cannot account for slight unit-to-unit variations
Like any mass-produced product, even the finest lenses can exhibit slight differences in performance under the gaze of critical users as you move from one individual lens sample to another. Canon MTF charts, as previously mentioned, are calculated based on computer simulations, using the design criteria in a lens’ final optical design. This has the advantage of minimizing any sample-to-sample variations, which might arise from direct test evaluations using projection or other methods. Of course, it also presumes a near-perfect lens sample, and cannot account for differences in manufacturing tolerances, the real-life effect of vibration and shock in a customer’s lens, and so on.
MTF charts from different lens makers may not be directly comparable
Different companies use different standards — such as the thickness of lines on test charts, the types of charts and even the fundamental ways tests are carried out — in performing their own MTF tests. Highly technical factors in the evaluations can very, from one lens maker to another, as well. Therefore, while you can make loose and general comparisons between two similar focal length lenses from Brand A and Brand B, it’s usually wise to avoid jumping to firm conclusions if you’re comparing MTF test results from two different engineering staffs.
MTF charts cannot tell you how suitable a lens will be for any particular shooter
While the contrast and resolution readings on MTF charts give a good idea of important aspects of a lens’ likely image quality, they obviously cannot give a user all he or she needs to know about how well-suited a lens is to them. Regardless of MTF results, users have to consider other factors when thinking about a lens purchase: how important a particular focal length lens will be in their arsenal (given the type of work a shooter is likely to perform in the foreseeable future); a lens’ size/weight/portability; how well-balanced a lens’ handling is; how easily or readily it manually focuses; how close a lens focuses; whether a zoom lens’ range would be ideal or limiting in some way; whether its maximum aperture is well-suited to the type of work and environments he or she anticipates using it in; whether or not it offers features with real-life benefits like Image Stabilization; and of course, price.
SUMMARY
MTF charts offer a clear way to give users a good idea of the relative optical quality of one or more lenses. While slightly complex and non-intuitive at first, if you understand a few basics about them, it becomes a lot easier to digest an MTF chart’s information and apply it to your present and future lenses. They cover a lot of ground, but they are not all-encompassing — there’s no “magic bullet,” so to speak, that will tell you in one summary line which lens you’re considering is the unqualified best.
But on the other hand, they provide a good groundwork for looking at the broad range of Canon’s EF and RF lens system. They illustrate clearly, for instance, the absolutely superlative performance of many of Canon’s fixed focal length L-series super-tele lenses — or, perhaps less expectedly, how good lenses like the EF-S 60mm f/2.8 macro lens are. They provide a meaningful way to compare two similar lenses to each other or to quantify some of the benefits you’re likely to see in a higher-end lens versus a moderately priced one.
Think about the real-world meanings of contrast and resolution — understand that they’re two importantly different measures of optical quality, then begin to think about how the data in an MTF chart can be meaningful to you. A portrait photographer working at wide apertures, for example, may be very interested in how a particular lens’ MTF results appear toward the central area of his or her pictures when shooting wide-open, since he or she may rarely have important detail in a flat plane extending to the outer edges of his or her pictures. On the other hand, an event or wedding shooter who frequently photographs groups of people might learn more about a lens’ suitability by looking at how a lens’ MTF curves hold up at outer areas of the frame.
These are just a couple of examples of how, when you realistically assess your situation and your needs, you can begin to apply the info you’ve learned about MTF charts and make more informed choices and decisions about your Canon lens system. Finally, one more reminder: if you’re looking at an older, published Canon MTF chart, with curves for both wide-open and f/8, understand that wherever possible, you really want to be looking at the more updated charts, which are based on more critical testing methods — albeit using the lens’ wide-open aperture only.


